A while back I read a 2025 paper in the International Journal of Forecasting (Gurgul et al., “Deep learning and NLP in cryptocurrency forecasting”, free preprint) and got a little obsessed with one question: could I actually make it run? Not a notebook I open once and forget, but a real thing that wakes up every morning, fetches the day’s data and places a trade before I have had my coffee.
Turns out, yes. But the model was never the interesting bit. The interesting bit is the long, awkward gap between “wow, the backtest looks amazing” and “ok, would I really put my own money on this,” which is where most of these projects quietly die. That gap is most of what this post is about.
Here is the whole thing in one picture. It has two lives: a research half that I drive by hand to pick a strategy, and a live half that then trades it on its own, every morning, without me.
flowchart LR
  DATA["collect<br/>11 feeds"] --> FEAT["features<br/>+ sentiment"]
  FEAT --> TRAIN["train + tune<br/>models"]
  TRAIN --> PICK["backtest +<br/>pick best signal"]
  PICK ==>|freeze| BOT
  subgraph SRV["server · Docker · daily"]
    BOT["LIVE bot:<br/>refit · trade"]
  end
  BOT -->|refit daily| BOT
  BOT <-.->|"data + orders (encrypted)"| NET(("internet"))
  BOT ==>|"Telegram report (encrypted)"| PHONE["my phone"]
  linkStyle 5 stroke:#46c46e,stroke-width:2px
  linkStyle 6 stroke:#46c46e,stroke-width:2px
The first four boxes are research, run by hand on my laptop. The last box is the bot, alone on a small server. The two green links are the only things that ever cross the internet, and both are encrypted: the bot pulls data and places orders over HTTPS, and sends me a Telegram report. Everything else (the database, the models) stays on the box.
The data: eleven feeds, free only
I gave myself one rule: free data only (I am doing this on evenings and
weekends, not on a hedge fund’s budget). So there are eleven little async
collectors, all built the same boring way, fetch → transform → validate → store,
all pouring into a single DuckDB file.
mindmap
  root((11 free feeds))
    Market
      OHLCV candles
      CoinGecko
      Market context
      Google Trends
    On-chain
      Bitcoin metrics
    Language
      News RSS
      Reddit
      Nostr
      Mastodon
      GitHub
      Telegram
Free has a catch, and the catch is coverage. A paid aggregator like Glassnode or Coin Metrics Pro hands you hundreds of clean, deep series on a platter; my free version is a thinner, laggier slice I stitch together myself. The on-chain collector started on Google BigQuery until I noticed it bills you for the privilege, so I moved it to Coin Metrics’ free API and blockchain.com and the cloud bill went to roughly zero. The paper also had a Twitter firehose I cannot get for free, so I make do with Reddit, Nostr and Mastodon. Fine for a personal project, a real handicap for a serious desk.
The lesson that stuck is that collectors fail silently. A news feed dropping from hundreds of articles a day to four does not throw an error, it just starts feeding your model rubbish with a straight face. So the bot now watches its own intake and yells at me when a source dries up.
Sentiment, in triplicate
Every article and post gets scored by three models at once, each first attributed to the right coin so Bitcoin’s bad mood does not rub off on Ethereum. They are pretrained and only ever used for inference, I never fine-tune them.
flowchart LR
  D["news / social post"] --> V["VADER"]
  D --> R["RoBERTa"]
  D --> B["BART MNLI"]
  V --> SC["blended daily score"]
  R --> SC
  B --> SC
  SC --> TG["tagged to BTC / ETH"]
VADER is the grumpy old lexicon one, RoBERTa is a proper transformer classifier, and BART does zero-shot bull-versus-bear classification. They disagree constantly, and weirdly that disagreement is itself part of the signal.
Features: where the statistics earn their keep
flowchart TB
  T["47 technical indicators"] --> ST["stationarity gate<br/>ADF + Phillips-Perron + KPSS"]
  ST --> L["lag expansion<br/>14 horizons"]
  L --> G["Granger causality<br/>p #lt; 0.05, per target"]
  G --> M["final feature matrix"]
Before a series is allowed in, three stationarity tests (ADF, Phillips-Perron, KPSS) all have to agree it needs differencing (one test alone is too easy to fool). Then every feature is fanned out across fourteen lags, and a Granger-causality filter throws out everything that does not actually lead what I am trying to predict. My targets are tomorrow’s return and the forward extrema over 7, 14 and 21 days, and it turns out “is today a local top or bottom?” gives you far more to trade on than the rather hopeless “will tomorrow be green?”.
The part I’m proudest of: catching the backtest lying
Anybody can write a crypto backtest that prints +200%. Writing one you would actually trust is a different sport. So before believing a single number, I went through every stage hunting for the little ways future information sneaks backwards into the model.
| Stage | Leakage risk | What I did |
|---|---|---|
| Picking features with Granger over the whole series, future included | moderate-high | Owned it, documented as the biggest remaining risk |
| Tuning the buy/sell threshold on the fold I then scored | high | Fit it on the training side only, never the test block |
| Deciding once, over all data, which series to difference | low | Left it: leaks one yes/no bit, not a value |
| Walk-forward train/test boundaries | clean | Left alone |
Hunting those leaks before you let yourself get excited is the most useful habit I have in this work, and the one everybody skips, because it is deeply unfun: it only ever makes your results look worse and your story more honest.
From a probability to a trade
A model never says “buy”. It says “73% chance today is a local bottom”, and then it is on me to turn that into a real decision. Two small choices do that, and most of the strategy hides in them.
- The cutoff: where to draw the line. I only act once the probability clears some bar, and I pick that bar on the training side of each fold with Youden’s J, never on the data I am about to be graded on. The bot lives the same way, it only ever sees the past.
- The mask: a little rule combining models. I can AND two of them (both must agree, fewer but braver trades), OR them (more trades, more noise), or mix across horizons. The backtest tries the whole grid and keeps whatever survives out of sample.
Every candidate then goes through a VectorBT walk-forward backtest with real fees taken out, scored on the boring-but-important stuff: return, how much it beats buy-and-hold, Sharpe, drawdown, win rate, trade count.
Tested the way it will run
A walk-forward backtest, four folds. Train on the past, test on the next block of days the model has never seen, retrain at the seam, slide forward, repeat. The training window keeps growing, so each test chunk is always scored by a model that only saw days before it.
gantt
    title Walk-forward folds (expanding train, retrain at each seam)
    dateFormat YYYY-MM-DD
    axisFormat %b %y
    todayMarker off
    section Fold 1
        train :done, 2023-01-01, 2024-05-16
        test  :active, 2024-05-16, 2024-11-17
    section Fold 2
        train :done, 2023-01-01, 2024-11-18
        test  :active, 2024-11-18, 2025-05-22
    section Fold 3
        train :done, 2023-01-01, 2025-05-23
        test  :active, 2025-05-23, 2025-11-24
    section Fold 4
        train :done, 2023-01-01, 2025-11-25
        test  :active, 2025-11-25, 2026-06-01
Stitched together, the four test blocks give one continuous out-of-sample track from May 2024 to June 2026, roughly 750 days the models never trained on. And the regime matters at least as much as the method: over those two years Bitcoin wandered from about 65k to 71k, a grand total of +9.5% if you just held it. Two years of chop going basically nowhere, which is the friendliest possible weather for a timing strategy (and a fair, slightly humbling benchmark).
Results, told straight
xychart-beta
    title "Total return over the out-of-sample window (net of 0.1% fees)"
    x-axis ["MLP move", "Hold", "Logit", "XGB", "MLP", "MLP+Logit"]
    y-axis "Return %" -20 --> 110
    bar [-11.4, 9.5, 11.5, 12.7, 83.6, 98.5]
The winner, and the one the bot actually runs, is a mask: an MLP and a logistic regression that both have to agree there is a 7-day extreme before anything happens.
| Strategy (extrema_7d) | Trades | Win / loss | WR | Return | Sharpe | Max DD |
|---|---|---|---|---|---|---|
| MLP + logistic (AND) | 17 | 14 / 3 | 82% | +98.5% | 1.10 | -31% |
| MLP alone | 18 | 15 / 3 | 83% | +83.6% | 1.00 | -35% |
| XGBoost alone | 40 | 24 / 16 | 60% | +12.7% | 0.34 | -36% |
| Logistic alone | 49 | 33 / 16 | 67% | +11.5% | 0.33 | -39% |
| MLP, next-day movement | 162 | 72 / 90 | 44% | -11.4% | - | - |
| Buy & hold | 1 | - | - | +9.5% | - | - |
There is a fair objection in that table: if the MLP alone already makes +84%, why bother masking it? Because the pair is better on nearly every axis. Forcing a second model to agree kills off the MLP’s marginal trades, nudges the return to +98%, and (the part I care about more) gives a better Sharpe and a shallower drawdown. The lone model is good; the two of them nodding along is good and calmer, and calmer is what lets you sleep. So the bot trades the pair, not the star.
You can almost watch it work: it buys near the lows, sells near the highs, and the equity ratchets up while it mostly tiptoes around the early-2026 crash.
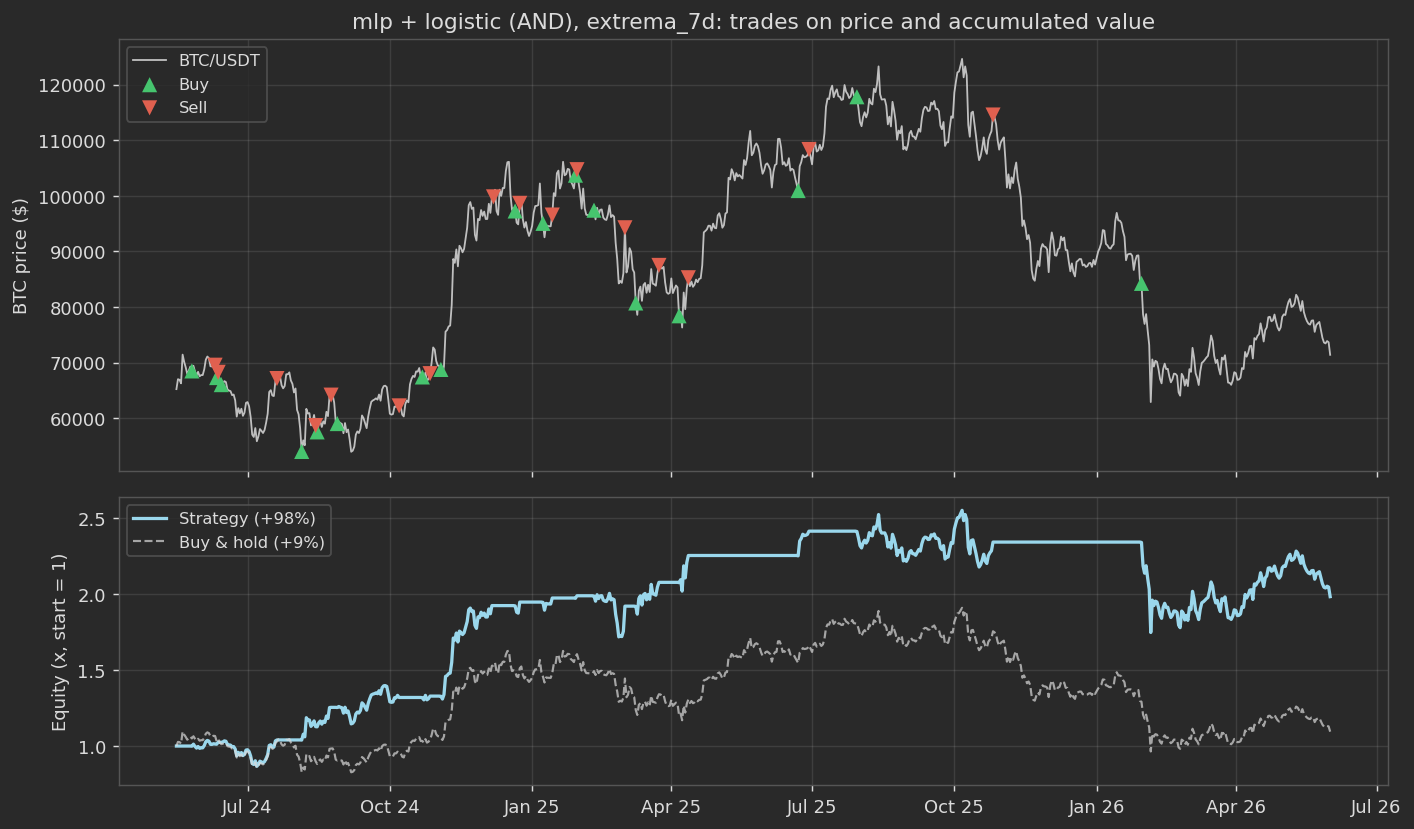
One thing in that picture is worth staring at. At the end of January 2026 it buys, around 84k, and then Bitcoin falls off a cliff, and it just … holds. It never cuts the loss, because the strategy has no stop-loss at all: it only sells when the model thinks a local top has arrived, and a market in freefall never looks like a top. So it sits there, underwater, waiting for a high that takes months to come (it is still holding that position at the right edge of the chart). Yes, it does this in every simulation, it is baked into the buy-low / sell-high logic, and it is the very first thing I would fix.
Now the rest of the caveats, because they are true. Plain next-day direction loses money (which, read the footnotes, is roughly what the literature admits too). The whole thing rests on 17 trades, and seventeen trades is a nice story, not a track record. And it leans hard on the regime: in a proper screaming bull run, a strategy that sits in cash half the time would probably get its lunch eaten by simply holding. So the honest takeaway is “a plausible little edge, worth testing with small and very real money”, and absolutely not “money printer”.
A quick word on the paper, since people ask. Its headline numbers are rosier than anything I could reproduce. Partly they had data I cannot get for free (a proper Twitter firehose), which helps. But the bigger reasons are duller: the regime you happen to test on, and how ruthlessly you hunt leakage. Nearly every too-good early result of mine turned out to be future information sneaking in, and scrubbing it out cost most of the shine. No finger-pointing, just that an honest reimplementation tends to land lower, and mine did.
Running it while I’m asleep
flowchart LR
  CR(["cron · daily"]) --> CO["collect new day"]
  CO --> RF["refit MLP + logistic<br/>on full history"]
  RF --> SG["frozen mask + cutoffs<br/>→ signal"]
  SG --> TR["place / skip trade"]
  TR --> LG[("JSON run log")]
  CO -.->|weekly| FE["rebuild features<br/>stationarity · NLP · Granger"]
  FE -.-> RF
A Docker image on a small ARM VM, pushed there through an Ansible role so I never end up hand-editing things on the server at 2am (a small promise to my future self). Every morning it pulls the new day, refits its models on the full history (ten seconds, give or take), runs the frozen mask, and either trades or shrugs and skips. Once a week it does the heavier job of rebuilding the whole feature pipeline, Granger reselection and all.
The thing that eats the time is none of the parts you would guess. Retraining the models is basically free, Granger is a few seconds. The real glutton, by a couple of orders of magnitude, is NLP inference, those poor transformers chewing through the day’s pile of articles one by one:
---
config:
  xyChart:
    height: 230
---
xychart-beta
    title "Where a daily run spends its time (seconds, in run order)"
    x-axis ["collect", "symbols", "NLP", "features", "train", "signals"]
    y-axis "Seconds" 0 --> 750
    bar [150, 4, 700, 44, 10, 2]
One thing the bot pointedly does not do by itself is choose the mask. That combination, and its cutoffs, were picked once, offline, by me, then frozen into a little config file. The models and features keep refreshing themselves, but which signal to believe stays where I left it until I redo the selection by hand. Every morning it just quietly sends me this:
🤖 Leon · paper · 2026-06-01
   BTC/USDT   $71,409

💼 Wallet
   Equity      $19,847   (+98.5%)
   Trades           17   ·   Win rate 82%

📍 Position: OPEN   bought 2026-01-30 @ $84,260
   Now $71,409   ·   unrealized -15.2%

🎯 Signal     hold (no exit yet)
   extrema_7d  mlp       exit 0.12/0.55 ·
   extrema_7d  logistic  exit 0.20/0.51 ·

🗣 NLP  2026-06-01
   BART MNLI  +0.18   RoBERTa  +0.07   VADER  +0.05
What I would do next
A short wishlist, roughly in order of how much I think it would matter.
- A stop-loss, or any risk overlay at all. The January trade above is the poster child: the bot has no way to bail out of a position going wrong, which is a bit silly. Even a crude trailing stop would have spared that drawdown.
- Let it reselect its own mask. Right now I freeze the winning combination by hand and the bot never revisits it. Re-running the selection on a schedule, and noticing when the old mask has gone stale, is the obvious next step.
- Better data. The whole thing rides on the free tier. Real on-chain depth and an actual X feed would close a lot of the gap with the paper, if I ever decided it was worth paying for.
- More than one coin, and real position sizing. It trades BTC, all-in or all-out. Spreading across a few assets and sizing by confidence would make the equity curve far less twitchy.
What I walked away with
The trading strategy turned out to be the least valuable thing in the project, which I did not expect. The boring parts, the data plumbing and the stubborn honesty around the numbers, are what was hard and what I would carry into anything else. Reproducing a paper is real work too, because the method section is quietly stuffed with decisions nobody wrote down. Most of the code took an afternoon a piece; the months went into the decisions around it, what to predict, what to distrust, what to quietly throw away. Which, now that I think about it, feels about right.
Stack
Python 3.12 · uv · DuckDB · pandas / numpy · scikit-learn ·
XGBoost · PyTorch · Optuna · transformers (RoBERTa, BART) · VADER ·
VectorBT · ccxt · statsmodels · Docker · Ansible
If this is the kind of thing you nerd out about too, I would genuinely enjoy talking it through, the architecture, the leakage-hunting, the on-chain plumbing, any of it. Come find me on LinkedIn.